
BLUF: Treat every new metric label as an admission decision. Keep request IDs and unrestricted tenant identifiers out of inference counters and latency histograms; allow only dimensions with an owned, bounded value set. Apply filtering before aggregation, test the actual SDK's overflow behavior, and count exported series rather than assuming that one instrument produces one time series. Overflow can preserve an overall request total while destroying the route or outcome breakdown needed for an SLO.
A local synthetic fixture for this article reduced one counter from 200 exported series to eight by retaining only route, outcome and release. The matching classic histogram fell from 1,200 series to 48. These are counts from a pinned SDK and exporter, not measured memory savings, a production benchmark or a universal backend limit. A separate overflow test preserved all 200 request increments but merged 125 into a point with no original diagnostic dimensions.
A healthy backend can still face a cardinality incident
The problem differs from telemetry backpressure during backend outages. Here, the backend can be reachable while a new label creates an expanding population of independent series. The application pays aggregation-state costs; exporters transport more points; storage and queries handle more label sets. A larger sending queue does not remove that multiplication.
Prometheus naming guidance states that each unique label-value combination creates a new time series and warns against unbounded identifiers. A route template such as /inference/{model} can be bounded; a raw path containing a customer or request identifier is not equivalent. Hashing an identifier changes its representation, not its cardinality. Moving it into the metric name is no solution either.
Start with a concrete decision: which breakdown changes an operator's response? Route class and terminal outcome often support reliability decisions. A request ID supports investigation of one operation. Those purposes should not share the same storage model. The existing inference SLO architecture provides the user-outcome contract; this article puts a budget around its dimensions.
Five quantities that must not be conflated
An instrument is the API object receiving measurements, such as a counter or histogram. An attribute set identifies an aggregation group after View processing. Collection-cycle cardinality describes the distinct metric points handled for that stream and collection boundary. Exported time series include the backend representation, resource/scope/target dimensions and histogram expansion. Retention-window cardinality also includes previously seen label sets, even when the current rollout has stopped emitting them.
The OpenTelemetry Metrics SDK specification describes attribute filtering, cardinality limits and the synthetic otel.metric.overflow attribute. Its configuration model is not proof that every language SDK exposes an identical knob. Nor is a per-stream limit a global process-memory limit: additional instruments, Views, readers, resources and replicas have their own costs.
For the synthetic design, two routes × two outcomes × two releases gives eight possible bounded combinations. Adding 25 tenants gives 200. Multiplying again by 200 request IDs gives a loose Cartesian ceiling of 40,000, not the observed population: each ID occurs on only one request, so the actual raw fixture has 200 combinations. Count observed tuples and retain the product as a declared upper bound; do not present an impossible cross-product as measured traffic.
Our classic histogram has three finite boundaries, one +Inf bucket, a count and a sum: six exported series per attribute set. Eight sets therefore produce 48 series. This formula is specific to that classic representation; Prometheus histogram guidance distinguishes native histograms, where a composite sample changes the series accounting. Native histograms still have bucket and sample-size costs. Do not translate fewer series directly into a claimed percentage reduction in RAM or storage.
Separate aggregate health from request evidence
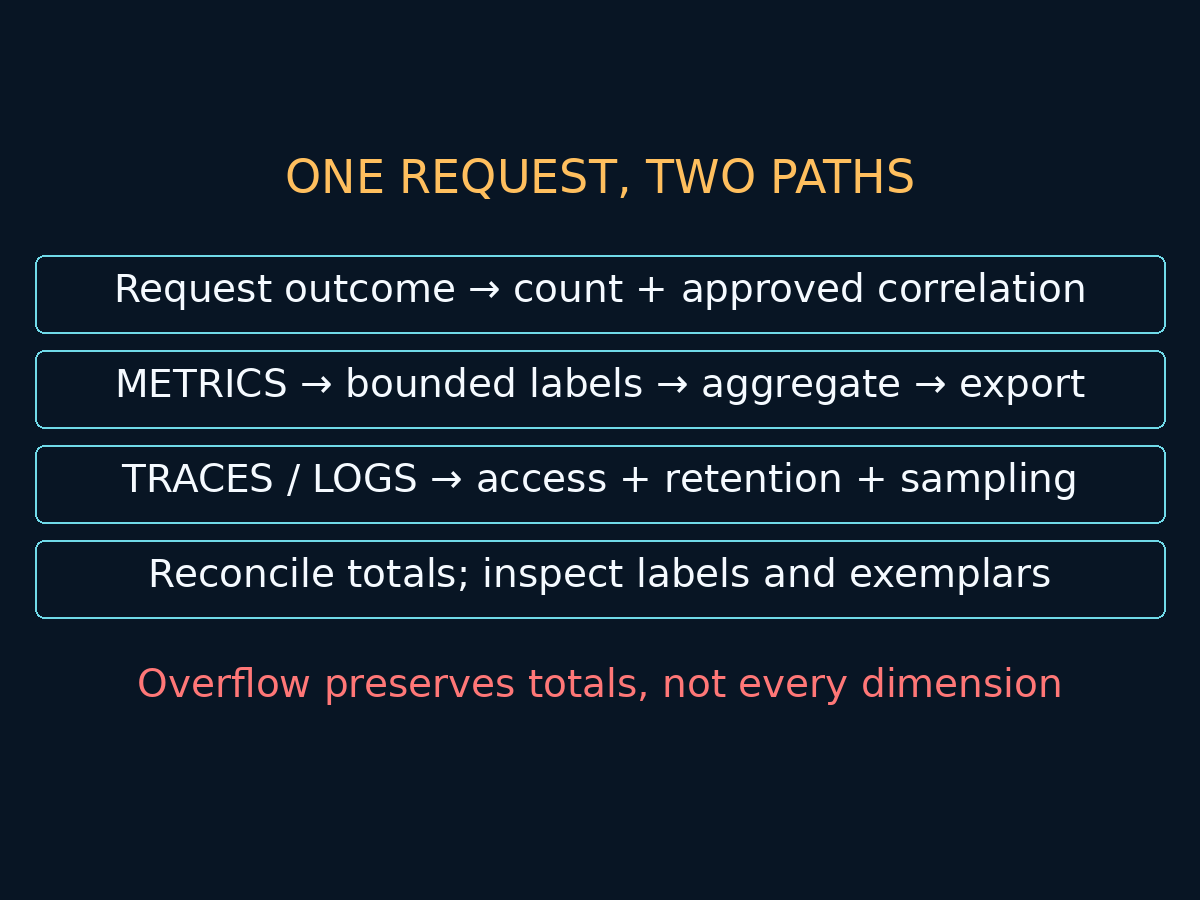
The metrics path accepts an allowlist, normalizes values to governed enums, aggregates and exports bounded operational groups. The diagnostic path carries approved request correlation into traces or logs with explicit access, redaction and retention rules. It is not an unrestricted prompt archive. An optional exemplar can connect the paths, but its attributes require separate review.
Removing a sensitive attribute from a metric stream is not a complete privacy control. The SDK specification warns that filtered attributes may still appear in exemplars. Disable or govern exemplar sampling and inspect the actual exported payload. Do not rely on a View alone to guarantee that an identifier never leaves the process.
Independent counters should retain the eligible-request denominator. Tail sampling for AI traces explains why selectively retained traces cannot replace it. Equally, a request total preserved in metric overflow does not preserve an error-rate numerator by outcome when the overflow point has lost the outcome label.
Reproduce the bounded-label experiment
The executed fixture used Node v22.22.3, @opentelemetry/sdk-metrics 2.12.0 and @opentelemetry/exporter-prometheus 0.223.0. These are reproduction pins, not an endorsement of every dependency for deployment. The test used synchronous counters, explicit-bucket histograms, a manual MetricReader with default cumulative temporality and the exporter's serializer. No production telemetry, Prometheus server, scrape network or memory-pressure benchmark was involved.
Install the pinned SDK/exporter plus @opentelemetry/api 1.9.0 in an isolated npm project and retain its package-lock.json. Generate a deterministic nested cohort in route, outcome, release, tenant order: route = chat or embed; outcome = ok or error; release = a or b; tenant = tenant-0 through tenant-24. Give each of the resulting 200 rows a unique req-N identifier. For each row, add one to ai_requests and record 0.2 seconds in ai_duration. Set histogram boundaries to [0.1, 0.5, 1].
Create a fresh MeterProvider for each scenario so previous cumulative state cannot contaminate the comparison. First retain all attributes with a deliberately generous aggregationCardinalityLimit of 1000. Then use the following View pattern on each instrument; the histogram View also needs the explicit-boundary aggregation. This is JavaScript configuration, not a portable Collector YAML setting:
{ instrumentName: 'ai_requests', attributesProcessors: [createAllowListProcessor(['route', 'outcome', 'release'])], aggregationCardinalityLimit: 1000 }
The version-pinned View implementation exposes these options. The local installation verified that the allowlist processor exists and the configured Views run. An inspected Python SDK 1.45.1 View interface did not expose the same cardinality parameter; copying this option into Python would not reproduce the experiment.
After reader.collect(), inspect resourceMetrics.scopeMetrics and locate each instrument by descriptor name. Assert that counter values sum to 200 and histogram counts also sum to 200. Serialize that collection with PrometheusSerializer and count the non-comment samples belonging to each instrument. This serializer is an implementation-level test dependency, not a stable cross-language contract. Its observed histogram family was ai_duration, with unit metadata s; do not assume it silently appends a seconds suffix.
Measured counts and the resulting decisions
| Scenario | Counter series | Classic histogram series | Reconciled requests | Operating decision |
|---|---|---|---|---|
| Raw request and tenant IDs | 200 | 1,200 | 200 | Reject unbounded dimensions before aggregation |
| Allow route, outcome, release | 8 | 48 | 200 | Keep the bounded operational breakdown |
| Keep tenant; remove request ID | 200 | 1,200 | 200 | Request-ID removal alone is insufficient |
| Bounded labels; limit set to 4 | 4 | 24 | 200 | Total survives; overflow loses breakdown detail |
| Five release cycles, cumulative | 20 | 120 | 1,000 | Budget retained release churn, not just one cycle |
These counts exclude target_info and other metric families. The serializer also added otel_scope_name and otel_scope_version to the samples. They were constant in this fixture, so they did not multiply its counts. Different scope versions, replica identities, resource-to-label conversion or scrape target labels can create additional series in a real pipeline. Validate the final exposition and stored labels, not only the application's input attributes.
The tenant case deliberately keeps the same 25 synthetic tenants across all eight bounded groups. Each tenant has one request in every group, so removing request_id alone does not reduce this cohort's 200 groups. Real traffic may behave differently; the point is to test the remaining dimensions rather than declare success after banning one familiar label.
Overflow is loss of detail, not necessarily loss of increments
For a separate stress case, keep only route, outcome and release but set aggregationCardinalityLimit to 4. In the pinned JavaScript implementation, the delta processor reserves capacity for overflow: its internal ordinary-group threshold is the configured value minus one. With this fixture's order, three ordinary points each contain 25 increments and one overflow point contains 125. The total remains 200, and the histogram's total count also reconciles.
That is a measured implementation behavior, not a claim that the current specification and every SDK have identical boundary semantics. Test the exact limit boundary, temporality and version you deploy. The specification describes no double-counting or dropped synchronous measurements during overflow; our single-collection test proves the stated fixture result, not exhaustive conformance under concurrency, restart or every instrument type.
The overflow point contains otel.metric.overflow=true instead of the original route, outcome and release. A dashboard filtering outcome=error therefore cannot classify those 125 increments. A correct total can coexist with an incorrect or incomplete SLO breakdown. Prefer a separately budgeted, low-dimensional reliability counter and treat any overflow in its required dimensions as an instrumentation incident. Do not silently discard the overflow point to make a graph look cleaner.
In the release-churn case, each collection records 200 requests under a new release value, while route and outcome remain bounded. After five collections with a cumulative reader, the output contains 20 groups and a total of 1,000 requests. A per-cycle view of four new groups is not the same as 20 accumulated groups. This test used the generous limit; it does not establish long-running cumulative overflow behavior or a lifetime memory ceiling.
An admission checklist for the next instrumentation change
1. Name the operator decision, instrument, unit, owner and required SLO dimensions. Reject labels without an operational consumer.
2. Specify allowed keys and bounded values separately. A key allowlist does not stop release, route or tenant values from growing. Normalize route templates, define terminal-outcome enums and govern how long release identities remain relevant.
3. Calculate a declared worst-case product, then measure actual tuples. Include histogram representation, targets, scope/resource expansion and coexistence during rollout. Separate active-series, retention-window and sample-volume budgets.
4. Run the fixture with unique request IDs, many tenant IDs, release churn and an intentionally small limit. Reconcile input increments and histogram counts; inspect overflow attributes and final exported labels. Add multi-cycle overflow, restart and concurrency tests before claiming those boundaries.
5. Gate changes on both capacity and correctness: accepted series growth, no unapproved labels, preserved totals, required breakdowns and explicitly reviewed exemplar payloads. A lower series count is not a pass if it removes the dimension needed to detect a user-impacting failure.
6. Canary the change and measure process memory, collection/export duration, ingested series, query behavior and missing-data alerts in the real backend. Keep a rollbackable instrumentation configuration. The Prometheus instrumentation guidance offers useful cardinality heuristics, not one universal ceiling for every estate.
What this buys—and what it does not
Filtering shifts the trade-off from uncontrolled storage growth to deliberate loss of diagnostic dimensions. Dedicated traces and logs preserve some investigative depth but add access, retention, sampling and operational costs. SDK limits are a safety boundary, not a substitute for a label contract; exporter translation and backend retention remain separate layers.
For one inference gateway, bring an instrument inventory, representative redacted label sets, the SDK/exporter versions and the queries that drive operational decisions. An architecture review can turn those inputs into an owned label allowlist, a reproducible cardinality test and a rollout gate. The deliverable should show which evidence survives a capacity limit—not merely that the monitoring backend stays green.