BLUF: Predictive maintenance is not primarily a model-selection problem. In production, the hard work is building a reliable data path from machines to time-series storage, adding asset and maintenance context, scoring failure risk with measurable uncertainty, routing recommendations through approval gates, and feeding outcomes back into the model and the CMMS. If those loops are missing, the project becomes a dashboard that operators eventually ignore.
For German industrial companies, the practical goal is not to “predict every failure”. The goal is to reduce unplanned downtime, avoid unnecessary preventive maintenance, and give maintenance teams earlier, better-prioritized evidence. That requires an architecture that respects shop-floor constraints: intermittent connectivity, noisy sensors, legacy PLCs, shift handovers, spare-part lead times, and clear accountability when an AI recommendation affects production.
Reference architecture
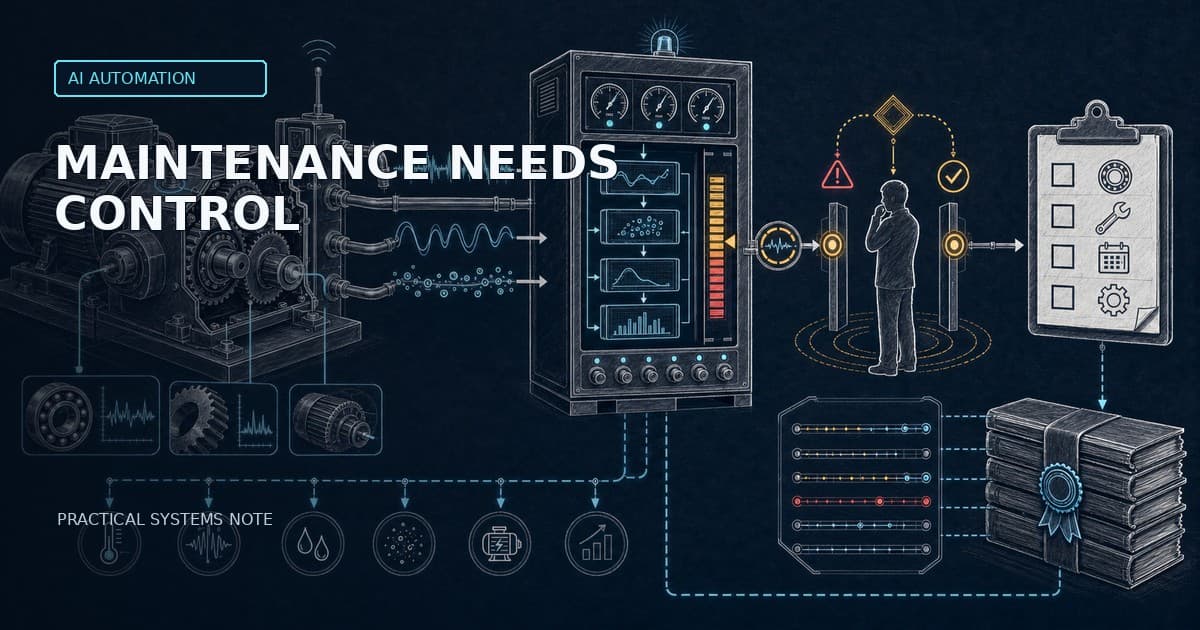
A robust predictive-maintenance stack has seven layers: machine data acquisition, edge buffering, industrial data modeling, feature and event processing, model scoring, decision workflow, and learning loop. The layers are boring by design. They make failure modes visible before the AI system influences maintenance scheduling.
1. Machine and sensor layer: vibration, current, temperature, pressure, cycle counts, alarms, PLC state, quality rejects, and operator notes. Do not start with every available signal. Start with the assets where downtime cost and failure history justify instrumentation.
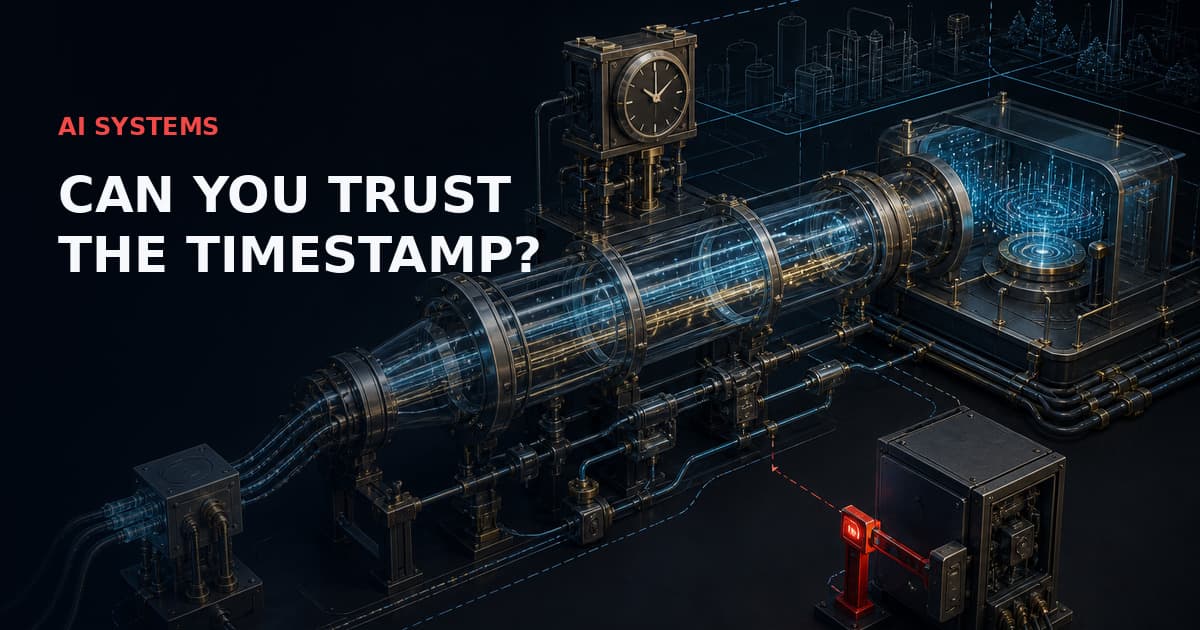
2. Edge gateway and buffering: OPC UA, Modbus TCP, Ethernet/IP, MQTT, historians, or vendor connectors feed an edge gateway. AWS IoT SiteWise, for example, documents industrial ingestion through OPC UA sources, edge processing, asset models, metrics, alarms, and SiteWise Edge for limited connectivity or data-residency constraints. The pattern matters more than the vendor: buffer locally, timestamp correctly, and make late-arriving data explicit.
3. Asset context model: map raw tags to assets, lines, components, maintenance plans, bill of materials, and operating modes. A bearing temperature is not useful without the motor, load, line, shift, and recent maintenance history behind it.
4. Feature and event layer: compute windows such as rolling mean, standard deviation, spectral features, rate of change, operating-mode-normalized baselines, alarm counts, and time since last intervention. Separate real-time features from batch features so the online scoring path is predictable.
5. Model layer: use the simplest model that matches the data maturity. Thresholds and anomaly detection are often enough for a first deployment. Survival models, gradient-boosted models, or sequence models make sense only when labelled failure and maintenance outcomes are reliable. Each score should include confidence, driving signals, and a recommended next diagnostic step.
6. Decision workflow: do not let the model directly create high-impact maintenance orders. Route recommendations into a workflow with severity, evidence packet, suggested action, spare-part implication, production-window constraints, and human approval. This is where n8n, a custom backend, or a state-machine service can coordinate notifications, CMMS tickets, escalation, and logging.
7. Learning loop: after maintenance, capture what happened: confirmed fault, false positive, no fault found, planned replacement, postponed action, spare part unavailable, or sensor issue. Without this feedback, model quality cannot improve and the business case becomes unverifiable.
Comparison table: architecture choices
| Choice | Works well when | Risk if ignored |
|---|---|---|
| Edge-first ingestion | Network links are unreliable, data must stay near the plant, or low-latency alarms are needed | Cloud-only pipelines miss bursts, hide outages, or create blind spots during connectivity loss |
| Asset model before AI model | Tag names are inconsistent, assets move between lines, or multiple plants report differently | Features become plant-specific hacks that cannot scale |
| Threshold/anomaly baseline first | Failure labels are sparse, sensors are new, or maintenance history is incomplete | Teams overfit a complex model and cannot explain recommendations |
| Approval-gated work orders | Recommendations affect production, safety, warranties, or expensive spare parts | Operators lose trust or automation creates avoidable downtime |
| Outcome feedback loop | The organization wants measurable ROI and model improvement | False positives and missed failures stay anecdotal |
Implementation sequence
Start with one asset class and one failure mode. Good candidates are components with recurring downtime, measurable degradation signals, and maintenance actions that can realistically change the outcome. Compressors, pumps, motors, spindles, conveyors, and refrigeration units are common starting points, but the best candidate is the one with clean enough data and a maintenance owner who will use the workflow.
Define the economic unit before the model: cost per hour of downtime, mean time to repair, spare-part lead time, current preventive-maintenance interval, and acceptable false-alarm rate. A model with 90 percent offline accuracy can still be operationally useless if it alerts too late or produces alarms during every shift change.
Instrument the data contract. For every signal, define unit, frequency, timestamp source, missing-data behavior, retention period, asset mapping, owner, and quality checks. NIST’s AI Risk Management Framework is useful here because it frames trustworthy AI through govern, map, measure, and manage functions. In engineering terms: know the context, measure performance and risk, and manage the system continuously rather than treating model deployment as the finish line.
Build the first scoring service as a conservative advisor. It should produce an evidence packet: asset, abnormal pattern, comparison against baseline, recent operating mode, similar historical cases if available, confidence, recommended diagnostic test, and the consequence of doing nothing. The maintenance planner should be able to reject the recommendation and state why.
Connect to CMMS only after the recommendation format is stable. A low-risk first step is to create draft work orders or tasks requiring approval. Full automated ticket creation is reasonable later for low-impact inspections, but not for interventions that stop a line.
Operational controls and metrics
Track model metrics and maintenance metrics together. Precision, recall, lead time before failure, missed-event rate, false-positive rate, and data freshness are model metrics. Downtime hours avoided, maintenance hours shifted from reactive to planned work, spare-part availability, work-order acceptance rate, and operator override reasons are operating metrics. Both sets are needed; one without the other creates a misleading view.
The main failure modes are predictable: sensors drift, operating modes change, PLC tags are renamed, maintenance actions are not recorded, a model trained on one line is copied to another without recalibration, or alerts are sent without enough context. Design monitoring for these cases before scaling beyond the pilot line.
Practical checklist
Use this checklist before approving a predictive-maintenance pilot for production: asset owner named; failure mode defined; downtime cost quantified; sensor list and data quality checks documented; edge buffering tested; asset model mapped to CMMS identifiers; baseline logic agreed with maintenance team; scoring output includes evidence and confidence; approval workflow tested; false-positive handling defined; post-maintenance outcome capture mandatory; dashboard shows both model and operational metrics.
When not to use predictive maintenance
Do not force predictive maintenance onto assets with low downtime cost, no actionable maintenance intervention, extremely rare failures, or missing operating context. In those cases, condition-based thresholds, better spare-part planning, or improved preventive-maintenance discipline may deliver more value with less complexity.
Sources
Sources used: NIST AI Risk Management Framework 1.0 for govern-map-measure-manage risk functions; AWS IoT SiteWise documentation for industrial ingestion, asset models, metrics, alarms, and edge processing; Microsoft manufacturing architecture documentation for the cloud-and-edge manufacturing context. Vendor examples are used as architecture references, not as product endorsements.
How I help
If Sie operate industrial equipment and want a realistic predictive-maintenance architecture, I can help assess the asset data, define the workflow boundaries, design the edge/cloud architecture, and build an approval-gated pilot that maintenance teams can actually use. The useful first step is a short technical assessment, not a large AI program.