
Page when the AI service is consuming its agreed error budget fast enough to require intervention—not whenever a model call fails. Define a user-facing good-event contract, pair long and short burn-rate windows, and test both alert activation and recovery. Keep low-traffic safeguards and missing-telemetry detection explicit: an absent ratio is not a healthy service.
This implementation walkthrough separates three decisions: whether a user outcome failed, whether the failure rate warrants interruption, and which team receives the notification. The numeric policy below is illustrative. Six synthetic Prometheus rule tests were executed with promtool 3.14.0; they are not production measurements or evidence of reduced on-call workload.
Start at the user boundary, not the model SDK
For an interactive assistant, define one eligible event per logical user operation at a declared service boundary. A good operational event might mean a complete response delivered within the agreed deadline and passing synchronous schema or policy checks. Count the operation once even if it triggers retries or multiple model calls. A provider error followed by a successful, timely recovery need not be a bad user operation; an HTTP 200 containing an unusable partial stream can be one.
Specify treatment of rejected admission, client cancellations, policy refusals and abandoned streams before instrumenting counters. Excluding overloaded requests can hide the very outage the SLO should detect. A legitimate safety refusal is not automatically a failure. A service that stops recording unfinished operations needs a timeout or expiry path; otherwise completed-request metrics develop survivorship bias during a hang.
Use bounded labels such as service and workload class. Do not place prompts, user IDs or request IDs in Prometheus labels. Export eligible and bad counters continuously, including initialized zero-valued bad counters. Assert bad ≤ eligible in instrumentation tests. Keep model-attempt error counters as diagnostic signals, not the denominator for user-operation reliability.
This is a narrower layer than operating inference with user-facing SLOs: that foundation identifies the service promise and request phases; this article implements the alert state and notification policy. Semantic correctness measured by delayed human review belongs in a separate quality indicator. Do not pretend every response has an immediate trustworthy correctness label.
Derive the burn threshold from a response decision
Burn rate is the observed bad-event fraction divided by the allowed bad-event fraction. For an illustrative 99.9% objective, the allowance is 0.001. A 1.44% bad-event fraction therefore burns at 14.4 times the allowance. For a 30-day reporting period, the conventional relationship is burn threshold = chosen budget fraction × 720 hours ÷ long-window hours.
For request-based SLOs, translating elapsed time into a fraction of the monthly request budget assumes a representative traffic rate. A quiet hour and a peak hour need not contain equal shares of eligible requests. Track actual bad and eligible counts over the reporting period as well; the time-based calculation is an alert-policy design approximation, not exact budget accounting under arbitrary traffic.
The Google SRE Workbook recommends multiwindow, multi-burn-rate alerting because one short window is noisy and one long window resets slowly. Require both windows in a pair to exceed the same burn threshold; combine separate urgency pairs with OR. The short window checks that the problem is still active.
| Policy lane | Long / short windows | Burn threshold | Intended action and limitation |
|---|---|---|---|
| Fast page | 1 hour / 5 minutes | 14.4 | Illustrative 2% budget fraction; interrupt only with a useful immediate response |
| Slow page | 6 hours / 30 minutes | 6 | Illustrative 5% fraction; sustained degradation with more time to respond |
| Ticket | 72 hours / 6 hours | 1 | Illustrative 10% fraction; owned investigation, not an unattended queue |
| Low or no traffic | Explicit count and health checks | Not a universal ratio threshold | Use probes or business-deadline checks; a ratio gate can conceal complete sparse outages |
These are candidate policy lanes, not universal thresholds. The executable fixture below implements only the fast-page lane and an independent missing-series signal. Add the other lanes only after their response owners and tests exist. Longer range queries also cost memory and evaluation time; monitor rule evaluation and choose a recording strategy appropriate to your Prometheus deployment.
Recording rules: aggregate outcomes before dividing
For each window W in 5m and 1h, record service:sli_error_ratio:W using the following expression, replacing both W occurrences with that window:
sum by (service) (rate(ai_service_bad_total[W])) / sum by (service) (rate(ai_service_eligible_total[W]))
Calculate rates per counter before aggregation so resets are handled per series. Divide sums, not the mean of per-instance ratios; otherwise a nearly idle instance can have the same weight as the busiest replica. Preserve the same service label on both sides. This example intentionally has one workload class; add the same bounded class label consistently to recordings, comparisons and vector matching when your contract requires separate classes.
The fast-page expression tested here is:
(service:sli_error_ratio:1h > 14.4 * 0.001) and on (service) (service:sli_error_ratio:5m > 14.4 * 0.001) and on (service) (sum by (service) (increase(ai_service_eligible_total[1h])) >= 100) and on (service) (sum by (service) (increase(ai_service_eligible_total[5m])) >= 20)
The 100-event and 20-event floors are deliberately illustrative engineering choices, not statistical confidence guarantees. increase extrapolates at window boundaries; it is not an exact audit count. These floors suppress noisy ratio pages and can also suppress a genuine low-volume outage. Pair them with an independently owned synthetic transaction, backlog-age or business-deadline check. Synthetic transactions must be safe, representative and separately labelled; they must not silently inflate the real-user denominator.
For the single expected fixture service, the independent telemetry expression is absent_over_time(ai_service_eligible_total{service="assistant"}[5m]). Label that alert AISLIMissing with severity=ticket. In a fleet, maintain an expected-service inventory and check each service plus scrape health: one global absent expression cannot detect one missing member while others still export. Missing bad counters, partial target loss and a frozen-but-present counter need separate integrity checks. A zero denominator must remain undefined, not be filled with a fabricated zero-error value.
Test firing and reset, not just syntax
Prometheus documents its rule unit-test format, including expanding input notation and stale samples. The following fixtures use one-minute samples and evaluation, one service label, the two recording rules above followed by AIServiceFastBurn, no for and no keep_firing_for. Fast-burn alerts carry severity=page. Missing-series alerts carry severity=ticket. No annotations are required for these minimal assertions.
| Fixture | Eligible / bad counter values | Evaluation | Expected firing alerts |
|---|---|---|---|
| Sustained error | 0+100x120 / 0+2x120 | 60m | AIServiceFastBurn |
| Short blip | 0+100x120 / 0+0x59 2+0x60 | 61m and 65m | No fast-burn alert |
| Recovery | 0+100x120 / 0+2x60 120+0x59 | 60m then 65m | Fast burn fires, then stops |
| Missing telemetry | 0+100x10 stale _x110 / 0+2x10 stale _x110 | 20m | AISLIMissing; no fast-burn alert |
| Sparse complete failure | 0+0.1x120 / 0+0.1x120 | 60m | No fast-burn alert: count gate suppresses it |
| No traffic | 0+0x120 / 0+0x120 | 60m | Neither alert; exporter exists, service health unknown |
Fractional sparse-counter increments are synthetic inputs used to exercise the count gate, not claims about fractional requests. Counter shorthand x120 denotes repeated sample increments, not a production load model. Put each fixture into input_series for ai_service_eligible_total{service="assistant"} and ai_service_bad_total{service="assistant"}; assert the named alerts through alert_rule_test. For a firing fast alert, exp_labels must contain service=assistant and severity=page; an empty exp_alerts list asserts absence. Set rule_files to your rules file and run promtool test rules tests.yml.
Executed result: all six cases passed. The test establishes the recording, vector-matching, threshold and reset behavior for those inputs. It does not test Alertmanager delivery, scrape scheduling, production counter integrity, additional burn lanes or whether the chosen SLO reflects customer tolerance. Before rollout, add counter resets, replica churn, a missing bad series, service-label mismatches, partial telemetry loss and failures arriving near evaluation boundaries.
Synthetic timeline: recovery is part of the contract
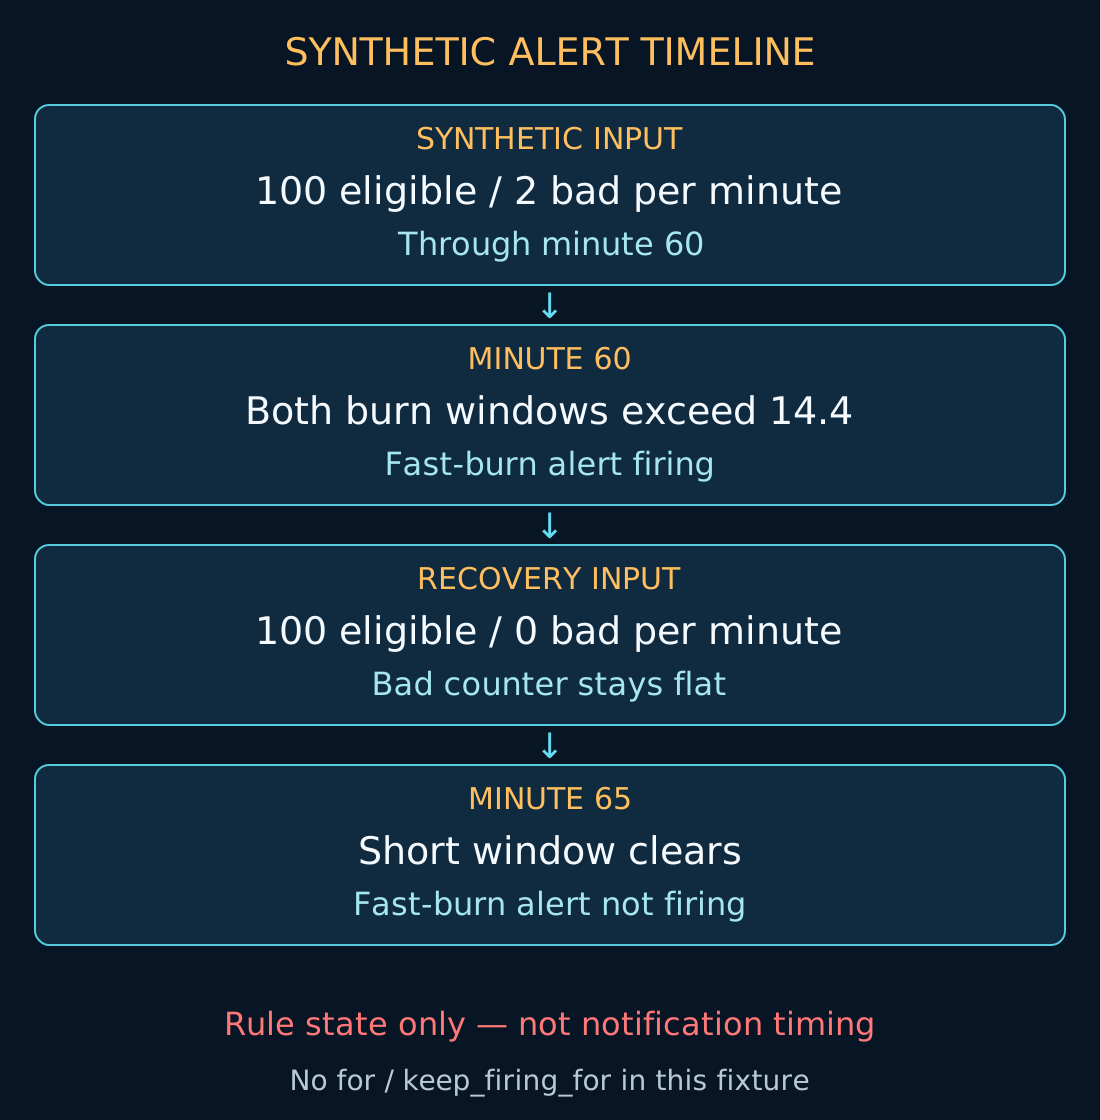
The recovery fixture is a clearly synthetic timeline: counters rise by 100 eligible and two bad events per minute through minute 60. The fast-burn alert is firing at minute 60. Eligible events continue while the bad counter stays flat; by minute 65 the short-window condition is false, so the alert is no longer firing despite the long window retaining incident history. This is a rule-state observation, not a claim that a pager notification arrives or resolves at those exact times.
The Prometheus alerting-rule documentation distinguishes for from keep_firing_for. The former requires continuous active evaluations before firing; it is not another averaging window. A long for can delay a total outage and reset repeatedly during intermittent faults. The latter retains an already firing alert for a chosen duration after the condition ceases; it can reduce flapping but intentionally delays resolution. Neither repairs missing instrumentation. Re-run the timeline fixtures if you add either field.
Route a page to a response, not to everyone
Alertmanager groups, deduplicates and routes alerts; inhibition suppresses notifications while a related alert is firing. None of these operations changes the underlying SLI or repairs the dependency. Choose a bounded grouping key such as service, environment and alert family. Do not group unrelated service owners into one opaque notification, and do not put a changing error value into an alert identity label.
Routing checklist: every page has an owner, a current runbook, a user-impact description and an immediate safe action. Tickets have an owner and response deadline. Choose group_wait, group_interval and repeat_interval against the response objective and test actual notification timestamps. Grouping delay is additional to scrape, evaluation and any for delay. A passing Prometheus rule test does not verify that the receiver is configured or reachable.
If fast and slow page lanes coexist, suppress the redundant lower-urgency notification only with explicit matching service and environment labels. Require those labels to exist on both alerts; do not rely on missing-label equality. Keep telemetry-integrity alerts outside broad dependency inhibition unless independent health monitoring is proven. Silences need scope, owner, reason and expiry; a resolved notification must not be interpreted as proof of service recovery during telemetry loss.
Automatic mitigation remains a separate authorization decision. The approval-gated AIOps remediation boundary applies even when a page is well founded. Measure detection and notification delays separately from diagnosis and repair, as in the MTTR decomposition; fewer pages alone do not demonstrate faster restoration.
Roll out one service contract before standardizing the fleet
First, review eligible/good/bad definitions with the product owner and on-call lead. Second, deploy the counters and integrity checks without paging and inspect actual traffic gaps. Third, run deterministic rule fixtures and end-to-end notification tests, including silences, inhibition and recovery. Fourth, enable one service with a rollbackable policy revision and an explicit sparse-traffic fallback. Review missed incidents as well as false pages before reusing the policy elsewhere.
The trade-off is deliberate: count floors improve noise control but reduce sparse-traffic sensitivity; extra windows add state and query cost; retained firing improves stability but slows reset. Operational success metrics still do not prove answer quality. For consequential AI decisions, retain separate quality, safety and approval controls rather than forcing them into one reliability ratio.
If your AI service pages on every upstream model error, bring one user journey, its counter contract and a recent alert timeline to an architecture review. I can help turn those inputs into versioned recording rules, executable firing/reset fixtures and an owned page-versus-ticket policy—without treating a quieter dashboard as proof of reliability.