BLUF — budget CPU inference across request concurrency, ONNX Runtime session pools and native preprocessing libraries. Increasing each independently can make a small model slower while CPU usage rises. Start from an explicit one-thread baseline, then change one layer at a time against arrival-to-completion latency, completed work and CPU cost. A configured thread count is a limit or pool setting, not a measurement of simultaneously running work.
For this article, a bounded synthetic ONNX graph was actually executed on a four-vCPU Linux guest. The deliberately aggressive configuration accumulated seconds of waiting at the same offered load that conservative configurations handled in milliseconds. That is a diagnostic example, not a production speedup claim: the workload is artificial, the host is shared, and the short samples cannot establish a reliable production p99.
Three owners compete for the same CPU budget
The ONNX Runtime threading documentation distinguishes intra-op parallelism inside an operator from inter-op parallelism across graph operators. ORT_SEQUENTIAL schedules graph operators sequentially; it does not mean each operator runs on one thread. An intra_op_num_threads value of one is a separate choice. Inter-op pools become relevant with ORT_PARALLEL, which may help branched graphs but can hurt other workloads.
Above that runtime sits application concurrency: HTTP workers, background consumers or in-process request threads. Below or beside it sit preprocessing libraries. NumPy matrix operations may call a native BLAS pool; other code may use OpenMP. The scikit-learn parallelism guide explains why a joblib n_jobs setting does not control every lower-level pool. Do not assume a server worker flag controls ONNX Runtime either.
Pool topology matters as much as the counts. Separate operating-system processes normally have separate runtime instances. Multiple ORT sessions within one process can each own an intra-op pool. Conversely, the OpenBLAS pthreads library inspected in this experiment exposes a process-wide pool shared by Python caller threads. Multiplying workers × ORT threads × BLAS threads would therefore be a false account of measured simultaneous CPU demand. These layers can also execute in successive phases rather than all at once.
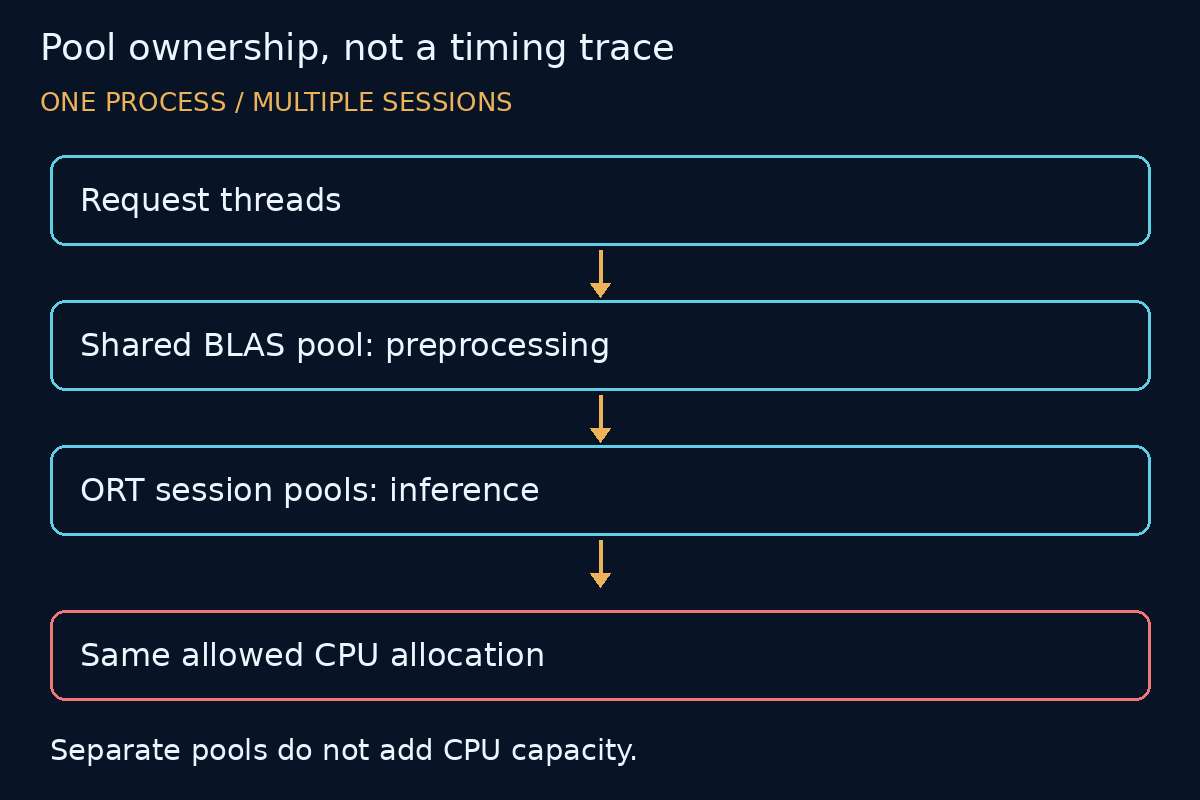
The diagram is a resource-ownership map, not a timing trace. A request passes through preprocessing and model execution. Native pools from different requests or sessions can still contend for the same allowed CPUs, and idle spinning can consume cycles between useful tasks. Separate pools do not create separate processor capacity.
Inventory the allocation before choosing a count
Record the process affinity mask, effective cpuset, cgroup path and every applicable ancestor CPU quota. A four-CPU affinity mask and a quota equivalent to one CPU are different constraints: affinity limits placement, while quota limits scheduled CPU time over a period. Host logical-processor count alone is not the container's budget. Also record topology, NUMA placement, virtualisation and whether neighbouring workloads can compete.
This execution used Python 3.12.13, ONNX Runtime 1.31.0, ONNX 1.23.2 and NumPy 2.5.4. The KVM guest reported an AMD EPYC-Milan processor, four logical CPUs, two cores with two threads each, and one NUMA node. Process affinity and the root effective cpuset were 0–3. Readable ancestor cpu.max files reported max 100000; the leaf exposed no cpu.max file. No finite ancestor quota was found in the visible hierarchy. This does not prove dedicated host cores or exclude hypervisor contention.
After importing numerical dependencies, inspect threadpool_info() or run python -m threadpoolctl -i numpy. The observed BLAS library was OpenBLAS 0.3.34.106.0 with its pthreads threading layer. The threadpoolctl project documents supported BLAS/OpenMP introspection and limits, as well as scope and mixed-runtime limitations. It is not a universal controller for ORT, process counts or operating-system affinity. Inspect the installed version rather than assuming the latest repository API exists locally.
An executed, deliberately bounded experiment
The fixture uses seed 62, float32 input of shape 32 × 512, a fixed 512 × 512 preprocessing matrix and eight MatMul/Relu stages sharing a fixed weight matrix. Weights are random teaching data, not a trained model. ONNX structural validation ran before CPUExecutionProvider execution. Each session received twenty warm-up calls. All cells kept the graph, input, graph execution mode, offered schedule and warm-up rule unchanged.
Each cell scheduled 240 requests at 80 arrivals per second independently of response completion. Latency starts at the intended arrival and ends after preprocessing, inference and a finite-output check. Consequently, generator scheduling delay and executor waiting remain visible; this is not pure kernel timing. Throughput below means completions divided by elapsed time from the first planned arrival through final drain. Slightly above 80 is possible because the finite schedule's final arrival precedes the end of a full three-second interval.
Workers in this fixture are Python ThreadPoolExecutor request-thread limits, not operating-system processes. The executor creates threads lazily, so a low-load cell need not exercise every configured caller. Shared means callers reference one ORT session; per-worker means one session is prepared for each possible caller. Preprocessing runs before ORT, not as an instrumented BLAS call inside ORT. This experiment exposes competing pools without claiming to trace nested operator execution.
Measured worker and pool matrix
The configuration column is request-worker limit / ORT intra-op threads / BLAS limit; S means shared session, P means per-worker sessions. Spinning refers to ORT intra-op waiting. All cells used ORT_SEQUENTIAL. Values are rounded from one execution per cell, not repeated-trial estimates.
| Configuration | Spin | p50 ms | p95 ms | p99 ms | Completed/s | CPU % |
|---|---|---|---|---|---|---|
| 1/1/1 S | off | 2.49 | 3.74 | 3.91 | 80.27 | 21.7 |
| 2/1/1 S | off | 2.66 | 3.51 | 3.98 | 80.24 | 22.7 |
| 2/1/1 P | off | 2.58 | 3.72 | 4.01 | 80.27 | 22.4 |
| 2/2/1 P | off | 2.59 | 3.14 | 3.41 | 80.25 | 35.4 |
| 4/4/4 P | on | 2371.52 | 4710.17 | 4890.52 | 30.25 | 399.5 |
| 4/4/1 P | off | 2.63 | 3.13 | 3.39 | 80.27 | 51.5 |
| 4/4/1 P | on | 2.42 | 15.96 | 19.65 | 79.47 | 344.7 |
| 4/1/4 P | off | 2.87 | 4.69 | 19.91 | 80.23 | 325.3 |
| 4/1/1 P | off | 2.45 | 3.60 | 3.89 | 80.24 | 21.1 |
All nine cells completed all 240 scheduled requests with zero recorded execution or non-finite-output errors. There was no admission cap or timeout; the intentionally small cohort drained completely. A production service needs bounded queues and deadline outcomes instead of relying on this teaching fixture's finite input. Process CPU is user plus system CPU time divided by wall time, with 100% representing one logical CPU's worth of time—not 100% of the entire guest.
Sampled process RSS ranged from 100.36 to 118.86 MiB. Cells ran sequentially in one interpreter, so allocator retention and previously loaded libraries make those numbers unsuitable for isolated per-session memory attribution. Root-cgroup throttling deltas were zero in the recorded window; root counters are broader than this process and do not establish absence of host contention. Main-thread context switches were retained, but these do not count all native worker switches. A production investigation should collect correctly scoped process/thread and container telemetry.
Read the evidence without inventing a winner
The 4/4/4 spinning cell combines multiple changes and cannot isolate one cause. The additional cells make the next investigation more specific: at 4/4/1, enabling spinning coincided with higher CPU consumption and a worse tail in this run; at 4/1, changing the BLAS limit from one to four also coincided with higher CPU cost. These are useful ablations, not a statistical estimate. Randomise repeated trials and isolate the generator before promoting a causal or capacity claim.
The 4/4/1 non-spinning cell did not reproduce the catastrophic queue. That matters: configured pool counts alone do not prove an oversubscription incident. Likewise, the shared and per-worker two-caller results are too close, too short and too lightly loaded to justify choosing one topology for production. The low-thread configurations met this modest offered load; they were not tested to maximum throughput.
Use the existing inference SLO framework to define acceptable service outcomes before tuning. Do not buy capacity simply because a CPU graph is busy. Conversely, do not accept a small p95 improvement if the candidate spends more CPU, worsens deadlines or fails output-quality checks.
Configuration controls and their boundaries
Set SessionOptions.intra_op_num_threads explicitly and choose execution_mode deliberately. Begin with ORT_SEQUENTIAL while isolating intra-op behaviour. Test ORT_PARALLEL and inter_op_num_threads separately only when the graph and workload justify it. The documentation notes that explicitly configured intra-op counts do not receive the same default thread-affinity behaviour as automatic configuration; preserve this distinction in the experiment manifest.
Use session.intra_op.allow_spinning = "0" as a tested candidate, not a universal recommendation. Spinning can reduce wake-up latency, but consumes CPU cycles and power while waiting. Newer time-bounded spin controls require version verification and their own experiment. Do not change thread count, affinity, spinning and graph optimisation together and then label the result a thread-count improvement.
Configure supported BLAS/OpenMP limits before worker work begins. In this fixture threadpool_limits(limits=..., user_api="blas") wrapped the entire cell, rather than racing different process-wide limits across requests. Some libraries have thread-local semantics; some share a process-wide pool. Controllers may not see libraries loaded after construction. Set and inspect limits at the correct scope, and keep ORT configuration separate.
Global ORT pools are another design option documented through runtime APIs, not a drop-in assertion that every Python binding supports a particular global-pool constructor. Verify the deployed binding and ownership lifecycle. Affinity or NUMA partitioning can reduce interference but can also strand capacity; no affinity-tuning result was measured here.
Decision table: what should change next?
| Observed evidence | Next controlled test | Risk or rejection condition |
|---|---|---|
| Tail and CPU rise after more sessions | Reduce session duplication at fixed workload | Shared-session semantics and concurrency must be validated |
| Waiting CPU rises without useful completions | Change spinning only; preserve thread limits | Wake-up latency may regress |
| Preprocessing dominates CPU time | Inspect and bound supported BLAS/OpenMP pools | Wrong scope or unsupported runtime leaves limits ineffective |
| Container throttling rises | Inspect ancestor quota and admission budget | More threads cannot create additional quota |
| Latency improves but outputs change | Re-run numerical and task-quality gates | A faster incorrect result is not accepted |
The ONNX numerical-parity gate remains independent of performance. This fixture checked finite outputs, not parity across every configuration or application accuracy. A production rollout must compare approved tensors and downstream decisions as well as latency; thread scheduling and different kernels can affect floating-point behaviour.
A release checklist that operations can reproduce
Check allocation: retain affinity, cpuset, quota hierarchy, topology, runtime versions and library backends. Check ownership: list request workers, session count, shared versus private pools and the phase that uses each pool. Check workload: freeze graph and input hashes, arrival schedule, warm-up, batch shape and preprocessing. Check measurement: retain every scheduled outcome, queue-inclusive latency, service time, CPU seconds, scoped throttling and memory observations.
Check acceptance: repeat randomised cells over representative quiet, peak and burst loads, with a bounded queue and explicit timeout/cancellation accounting. Reject generator-limited runs for capacity sizing. Compare variability, output quality and cost, not just the best percentile. The synthetic run reported here supplies a reproducible diagnostic pattern; its p99 is only an empirical percentile of 240 observations.
Store the approved settings and rollback baseline in the reproducible release bundle. For a CPU inference review, bring one model artifact, the deployment's effective allocation, a redacted arrival trace and the actual native-pool inventory. The useful deliverable is a measured retain, rebudget or isolate decision—not a rule that every worker should claim every core.